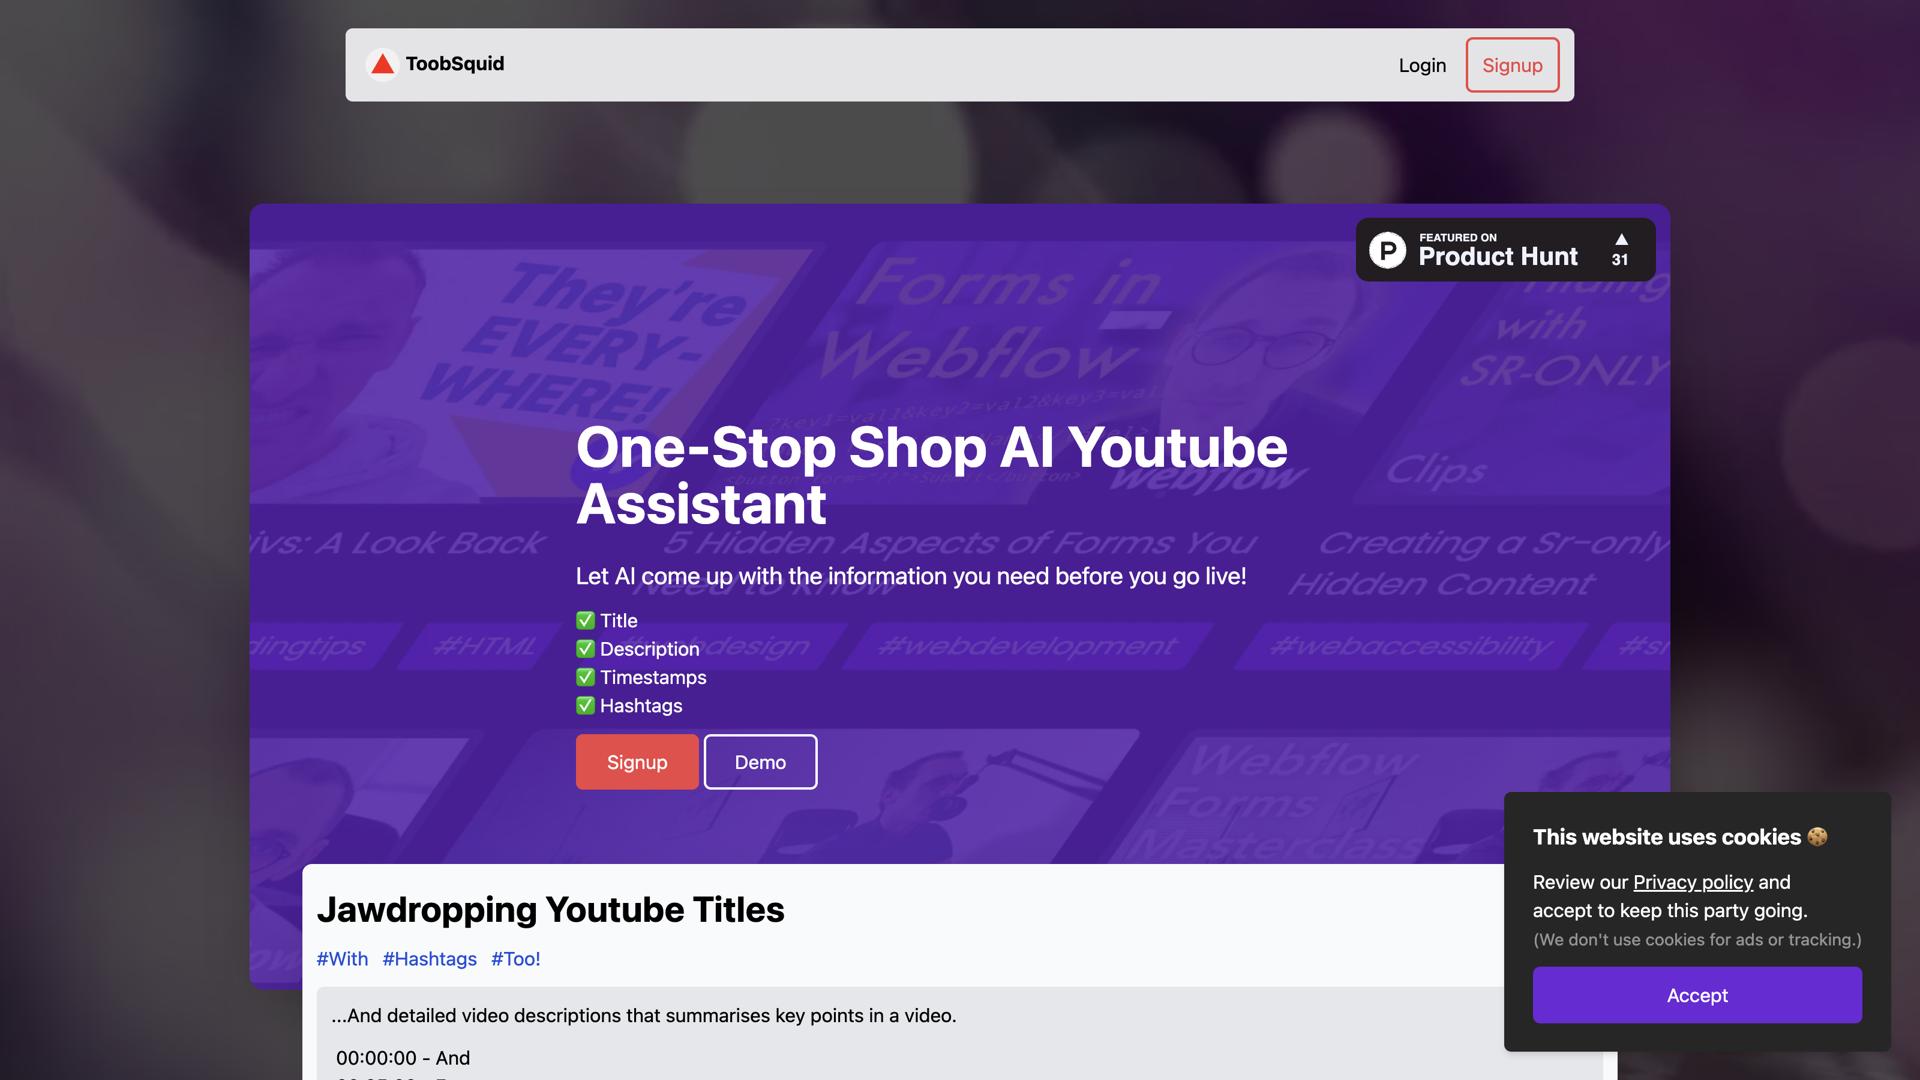
ToobSquid – AI-Driven Tool for Enhanced Data Visualization
Introduction to ToobSquidToobSquid is an innovative AI-powered data visualization tool designed to help businesses and analysts turn raw data into actionable insights. With its smart algorithms, ToobSquid automatically generates interactive graphs, charts, and dashboards, making data analysis more efficient and accessible. Whether you’re looking to understand trends, track performance, or communicate results, ToobSquid simplifies the process of visualizing complex data.
How ToobSquid WorksToobSquid uses advanced AI algorithms to analyze and interpret large datasets, then generates dynamic visual representations such as graphs and charts. This tool takes the guesswork out of data analysis by automatically selecting the best visualization techniques based on the type of data. Users can quickly customize their visualizations, gain insights, and make data-driven decisions with ease.
- AI-Generated Visualizations: Automatically create graphs, charts, and dashboards from raw data.
- Interactive Dashboards: Customize and explore data through interactive visual interfaces.
- Real-Time Analytics: Monitor and update data visualizations in real-time for up-to-date insights.
- Data Integration: Import data from various sources for seamless analysis and visualization.
ToobSquid is the perfect tool for anyone looking to make data analysis more accessible and impactful. Its AI-driven capabilities not only automate the visualization process but also ensure that the most relevant insights are highlighted. By using ToobSquid, you can save time and effort, improve decision-making, and enhance communication with visually appealing, easy-to-understand data representations.
- Time-Saving Automation: Automatically generates the best possible visualizations, saving time compared to manual creation.
- Easy Customization: Tailor your visualizations to meet your specific needs with intuitive customization options.
- Collaborative Features: Share interactive visualizations with team members and stakeholders for better decision-making.
- Real-Time Updates: Stay up-to-date with automatic data refreshes and real-time analytics.
ToobSquid offers a wide range of features designed to streamline the process of data analysis and visualization.
- Smart Visualization Algorithms: AI automatically selects the best visualization format based on your data.
- Customizable Graphs and Charts: Adjust colors, labels, and layouts to create the ideal presentation for your data.
- Interactive Features: Explore your data in-depth with clickable, interactive charts and graphs.
- Data Integration Support: Easily integrate with various data sources, including CSV, Excel, and cloud platforms.
ToobSquid is ideal for businesses, analysts, and organizations that need to make data analysis simpler and more efficient. Its AI-driven technology helps anyone from small business owners to large enterprises unlock insights from their data, visualize trends, and make informed decisions.
- Data Analysts: Quickly create clear, insightful visualizations to communicate findings.
- Business Leaders: Gain actionable insights to drive smarter business decisions.
- Marketing Teams: Visualize customer data and marketing metrics to measure campaign success.
- Financial Analysts: Use data visualizations to track financial performance and trends.
With ToobSquid’s AI-powered visualizations, complex data becomes easy to understand. The tool’s smart algorithms ensure that you always see the most relevant insights, making it easier to analyze, compare, and interpret your data. Whether for internal reports, client presentations, or performance tracking, ToobSquid transforms raw data into compelling stories.
ConclusionToobSquid is a game-changer in the world of data analysis and visualization. By automating the process of creating graphs, charts, and dashboards, it allows users to focus on making data-driven decisions rather than spending time manually interpreting data. Whether you’re a business owner, data analyst, or marketer, ToobSquid is the perfect tool to enhance your data analysis workflow and uncover valuable insights.
