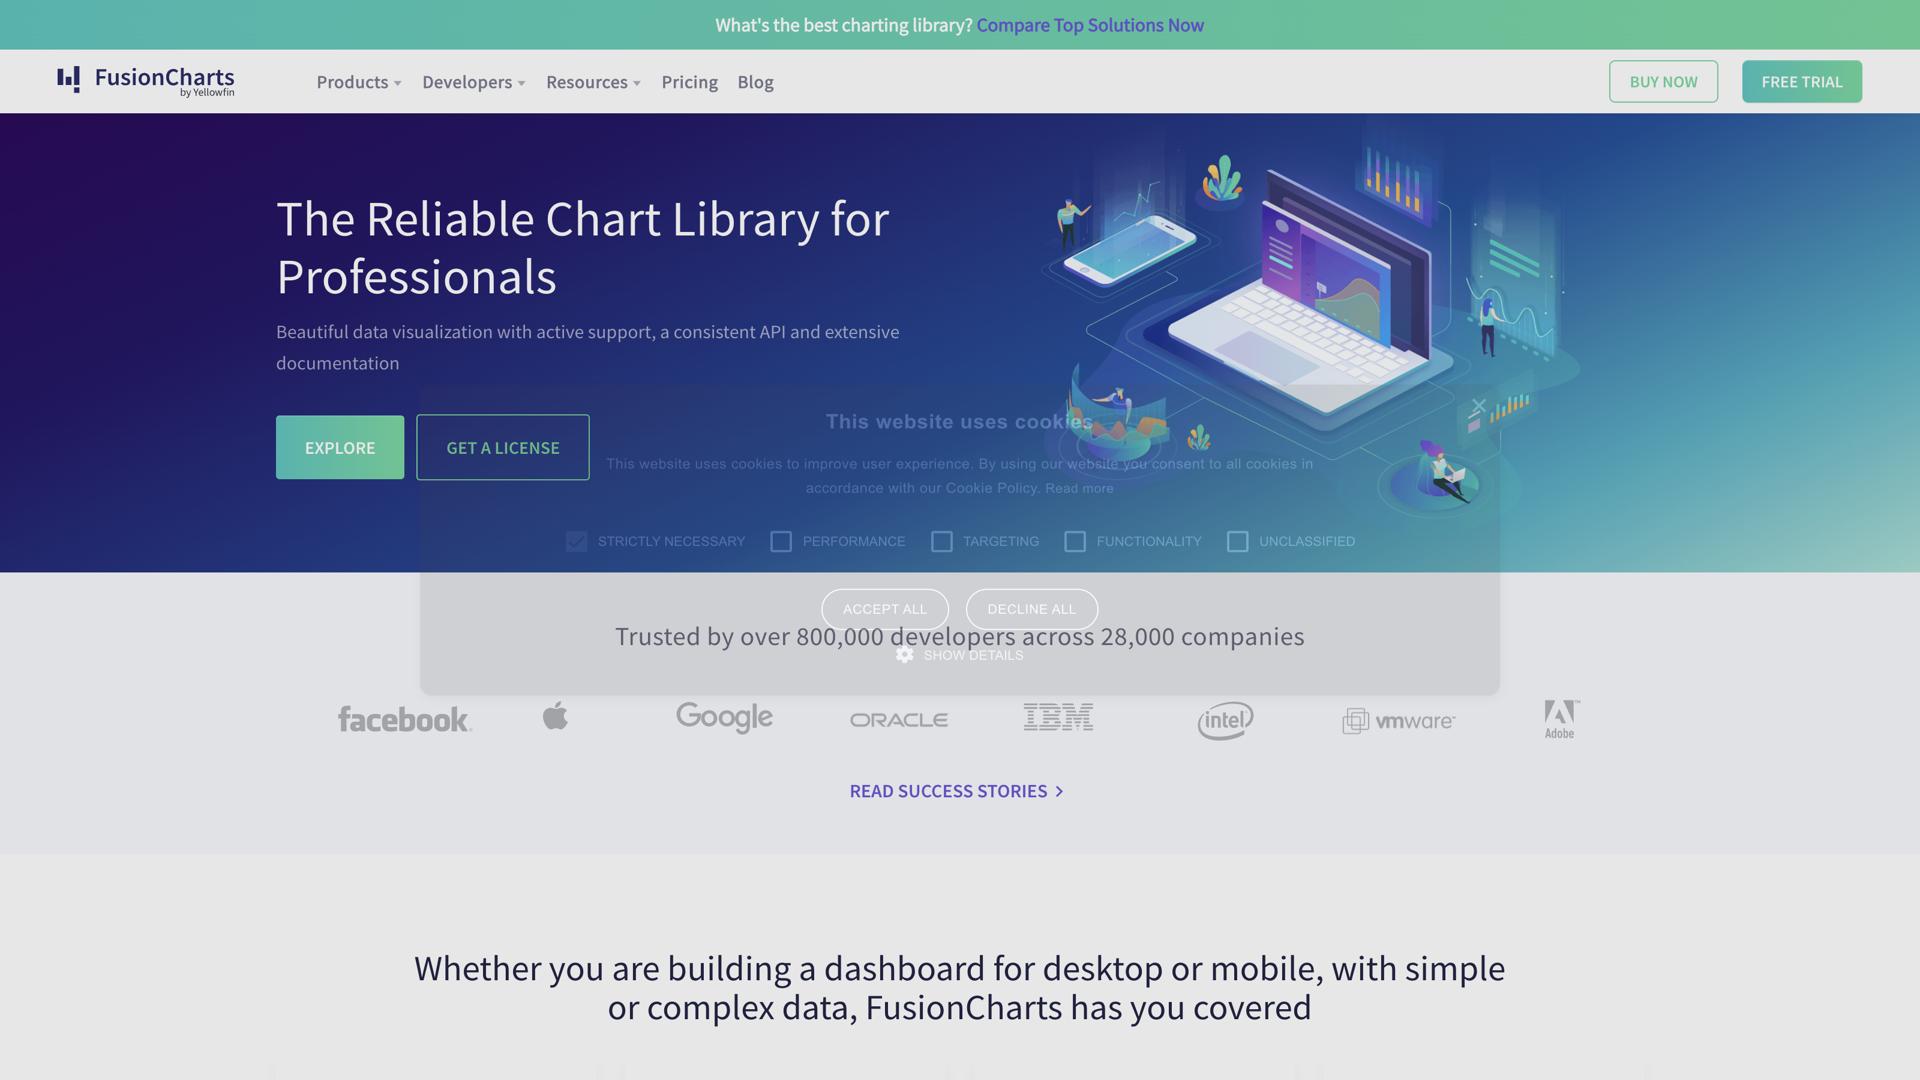
FusionCharts – Powerful Data Visualization & Interactive Dashboards
Introduction to FusionChartsFusionCharts is an advanced data visualization tool designed to create interactive charts, graphs, and dashboards. It provides a wide range of customizable chart types to help businesses and developers visualize data in an insightful and engaging way. With a focus on interactivity and ease of use, FusionCharts empowers users to convert raw data into meaningful insights that can be easily shared and analyzed.
How FusionCharts WorksFusionCharts enables the creation of interactive and dynamic data visualizations by using a simple, intuitive interface. The tool supports a wide variety of chart types, including bar charts, line charts, pie charts, and more. Developers can integrate FusionCharts into their websites, applications, and reporting systems with ease, allowing them to showcase data in ways that are both visually appealing and informative. The platform also allows for real-time data updates, ensuring that users always have access to the most up-to-date information.
- Interactive Visualizations: FusionCharts offers rich interactivity, such as tooltips, hover effects, and drill-down features.
- Customization Options: Highly customizable charts, from colors to data labels, ensuring a perfect fit for your brand or design needs.
- Real-Time Data Integration: Integrate real-time data feeds into your visualizations to keep them updated and relevant.
- Seamless Integration: Easily integrates with a variety of platforms and frameworks, including JavaScript, React, Angular, and more.
FusionCharts stands out for its versatility and comprehensive feature set. It is suitable for businesses looking to present their data in an interactive and visually appealing format. The platform supports a wide range of chart types and data formats, making it ideal for a variety of use cases, from business intelligence to performance tracking.
- Customizable Design: Tailor every aspect of your charts, from themes and color schemes to interactivity.
- Broad Compatibility: FusionCharts works seamlessly across various platforms and web technologies.
- Ease of Use: The intuitive interface makes it easy for both developers and non-developers to use FusionCharts effectively.
- Real-Time Reporting: Update charts with real-time data to provide live insights and reports.
FusionCharts offers a range of powerful features designed to enhance your data visualization experience.
- Extensive Chart Library: Choose from over 90 chart types, including area, bar, line, pie, and 3D charts.
- Interactive Dashboards: Create custom dashboards to monitor and analyze multiple data points simultaneously.
- Real-Time Data: Automatically refresh charts with live data from APIs or databases.
- Cross-Browser Support: FusionCharts ensures that your visualizations work seamlessly across all major browsers and devices.
FusionCharts is ideal for a wide range of professionals and industries looking to turn data into interactive, easy-to-understand visualizations.
- Data Analysts: Use FusionCharts to create engaging reports and dashboards for data analysis and decision-making.
- Business Intelligence Professionals: Visualize key business metrics and track performance indicators with interactive charts.
- Developers: Integrate FusionCharts into web and mobile applications to display data in rich, interactive formats.
- Executives: Gain insights from visually appealing charts that simplify complex data and help with strategic decision-making.
FusionCharts helps businesses and organizations communicate complex data in a simple and engaging way. With its rich set of interactive features, it transforms static data into a dynamic storytelling tool. By offering drill-down capabilities, tooltips, and real-time data updates, FusionCharts provides an immersive data experience that makes it easier to interpret and act on insights.
ConclusionFusionCharts is a powerful, flexible, and easy-to-use data visualization tool that helps users create interactive charts and dashboards. Whether you're a data analyst, business executive, or developer, FusionCharts provides the tools needed to create compelling visualizations that turn raw data into meaningful insights. With real-time data updates, extensive chart types, and seamless integration, FusionCharts is a must-have tool for anyone looking to enhance their data storytelling.
