ChartGPT – AI-Powered Data Visualization & Chart Creation
Introduction to ChartGPTChartGPT is an advanced AI tool that transforms raw data into visually appealing charts and graphs. It helps users analyze complex datasets, create reports, and improve decision-making with AI-powered visual insights.
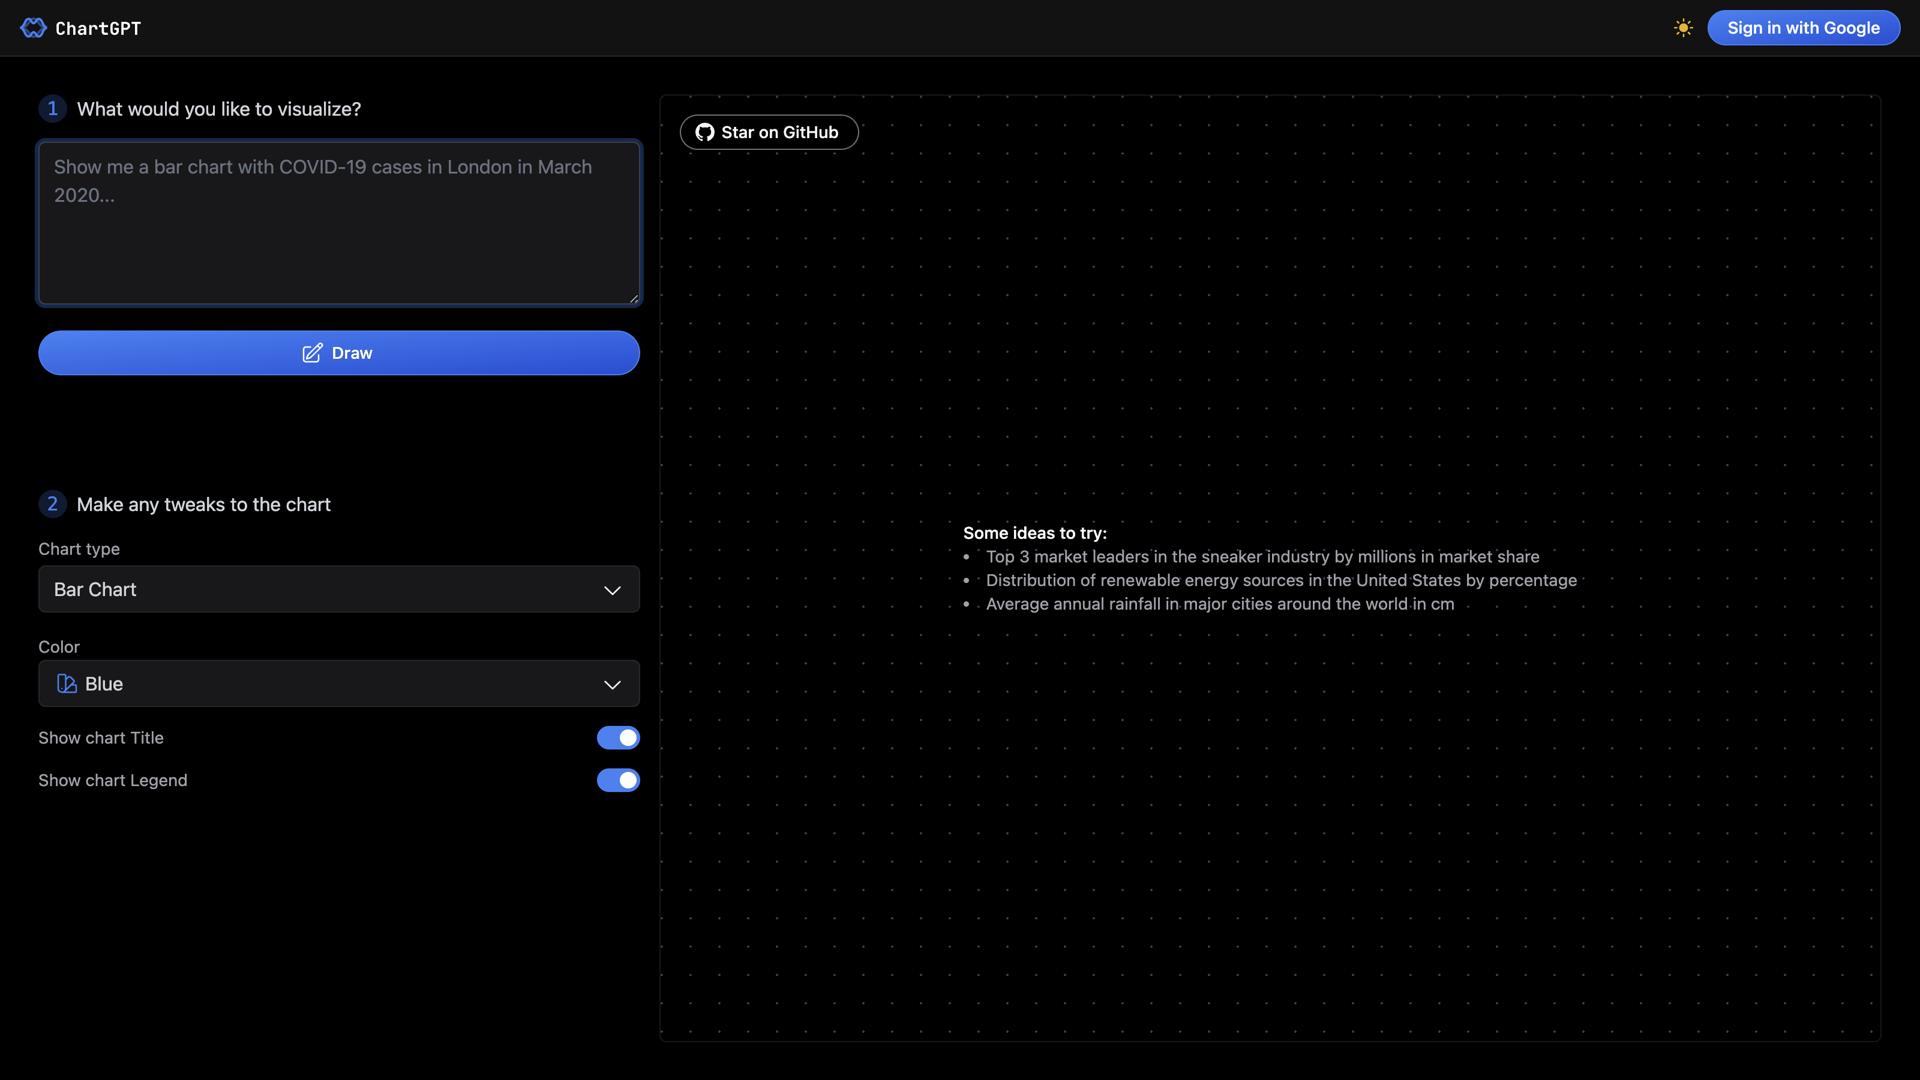
How ChartGPT WorksBy processing numerical and textual data, ChartGPT generates real-time visual representations that enhance understanding. Users can input data, and the AI automatically selects the most suitable chart format.
- Automated Data Analysis: Identifies patterns and trends in datasets.
- AI-Generated Charts: Creates bar charts, pie charts, line graphs, and more.
- Customizable Visuals: Allows users to modify colors, labels, and layouts.
- Seamless Data Integration: Works with spreadsheets, databases, and APIs.
ChartGPT simplifies the process of data visualization, making it ideal for professionals, researchers, and business analysts. It eliminates the need for manual chart creation by automating insights.
- Time-Saving Automation: Quickly generates accurate charts from data inputs.
- AI-Driven Accuracy: Reduces human error in data visualization.
- Interactive Graphs: Enhances presentations and reports with dynamic visuals.
- Easy Export Options: Supports multiple formats for sharing and embedding.
ChartGPT offers a range of features designed to enhance data representation and analysis.
- Smart Chart Selection: Suggests the best chart type based on input data.
- Real-Time Data Processing: Updates visualizations dynamically.
- Multi-Platform Compatibility: Integrates with analytics tools and dashboards.
- Custom Report Generation: Automates the creation of detailed reports.
ChartGPT is designed for anyone who needs clear, accurate, and visually engaging data representations.
- Business Professionals: Creates reports and business insights with ease.
- Researchers & Analysts: Visualizes complex datasets for better interpretation.
- Educators & Students: Enhances learning with interactive graphs and statistics.
- Marketing & Sales Teams: Tracks trends and performance metrics effectively.
ChartGPT simplifies data storytelling by converting numbers into meaningful insights. It helps users identify trends, make data-driven decisions, and communicate findings effectively.
ConclusionChartGPT revolutionizes data visualization by leveraging AI to generate professional charts and reports. It is a powerful tool for enhancing clarity and decision-making.